Custom filters exist such as our table making it easy to track the various signals.
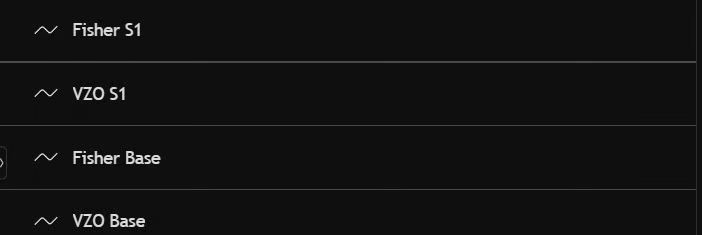
First you have to add the available chart filters you wish to use. Currently, we have the Fisher S1 and VZO S1. Make sure to click "Add to chart" for both of them.
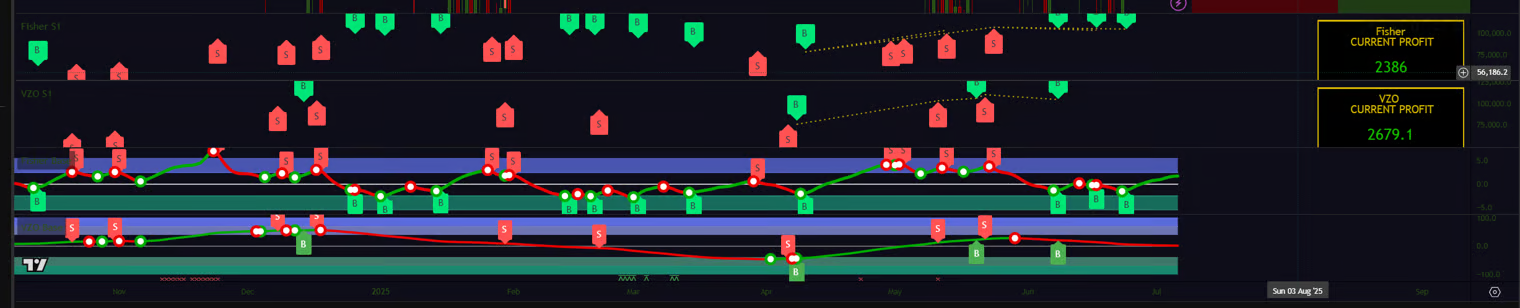
Your chart should look like this:
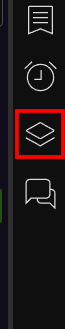
In order to apply the overlay to the chart, you wiill need to find the object tree. It is the third option under the clock:
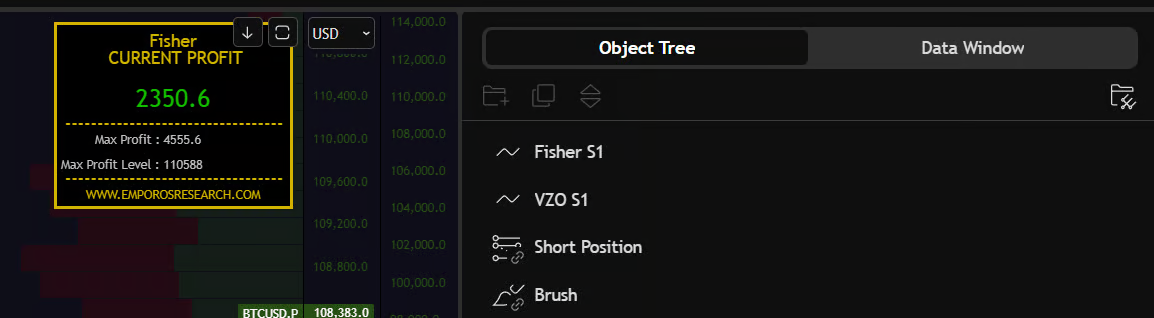
You may not have as much data in your object tree as shown in the image below. In anycase, all you need to do is drag Fisher S1 & VZO S1 to the very top of the object tree. You do not need to do anything with the base.
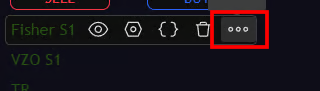
Now, you may have noticed that the overlays are not properly aligned on the chart. Let's fix that. All you have to do is click on the "..." to bring up the indicator settings.
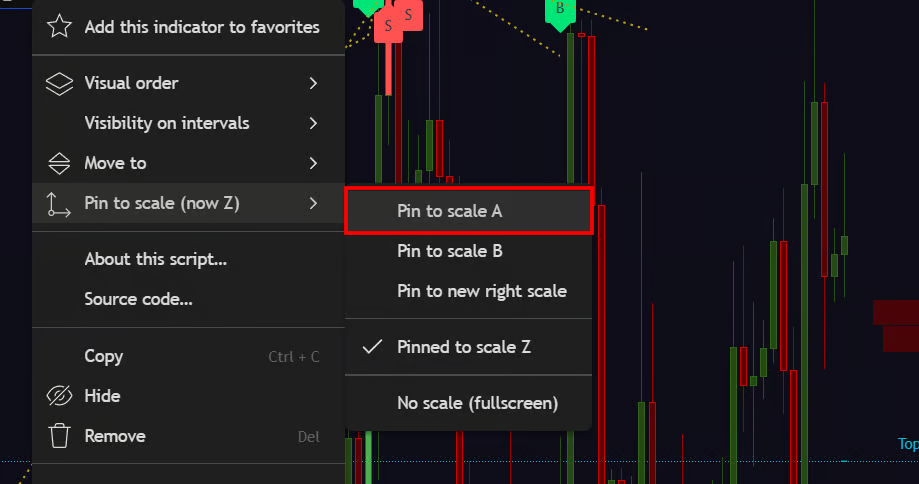
Then proceed to click "Pin to scale A" For both of the S1's.
Now you have the complete chart! All you need to do next is configure which features you would like to use.
❗ Recommendation
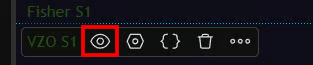
We recommend hiding either the Fisher or VZO and turning them on as you need.
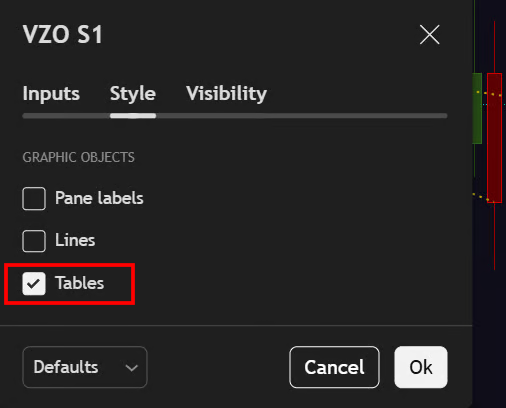
It is also highly recommended to try out the Tables filter for the Fisher S1. However, you can try them all out and explore!
Next we will go over on how to customize the indicators and remove some of the excess noise that may be cluttering some of the charts.